Enzyme Activity Lab for SBI4U:
Catalase, Rate Curves, and Inhibition
A free interactive where Grade 12 Biology students pick a factor — temperature, pH, substrate, enzyme, or inhibitor — write a hypothesis, run trials, and read the rate curve that catalase produces as it splits hydrogen peroxide into water and oxygen.
The quick answerThe Quick Answer
The Enzyme Activity Lab is a free, browser-based interactive built for Ontario's SBI4U Biology course. Students watch catalase — the enzyme in liver cells — split hydrogen peroxide into water and oxygen in real time. They pick one factor to investigate (temperature, pH, substrate concentration, enzyme concentration, or an inhibitor), write a hypothesis, run trials across a range of values, and read the resulting rate curve. They see the optimum, the denaturation cliff, the saturation plateau, and the difference between competitive and non-competitive inhibition. It maps directly to the Metabolic Processes strand (B2, B3) and lives in the public library so any teacher can open it or copy it to their dashboard.
Enzyme kinetics is taught with curves — the bell curve of temperature, the plateau of substrate saturation, the lowered Vmax of a non-competitive inhibitor. Students memorize the shapes, but they rarely get to produce one. A textbook diagram of a rate curve is a finished answer; it does not show the trials, the hypothesis, or the moment the line bends.
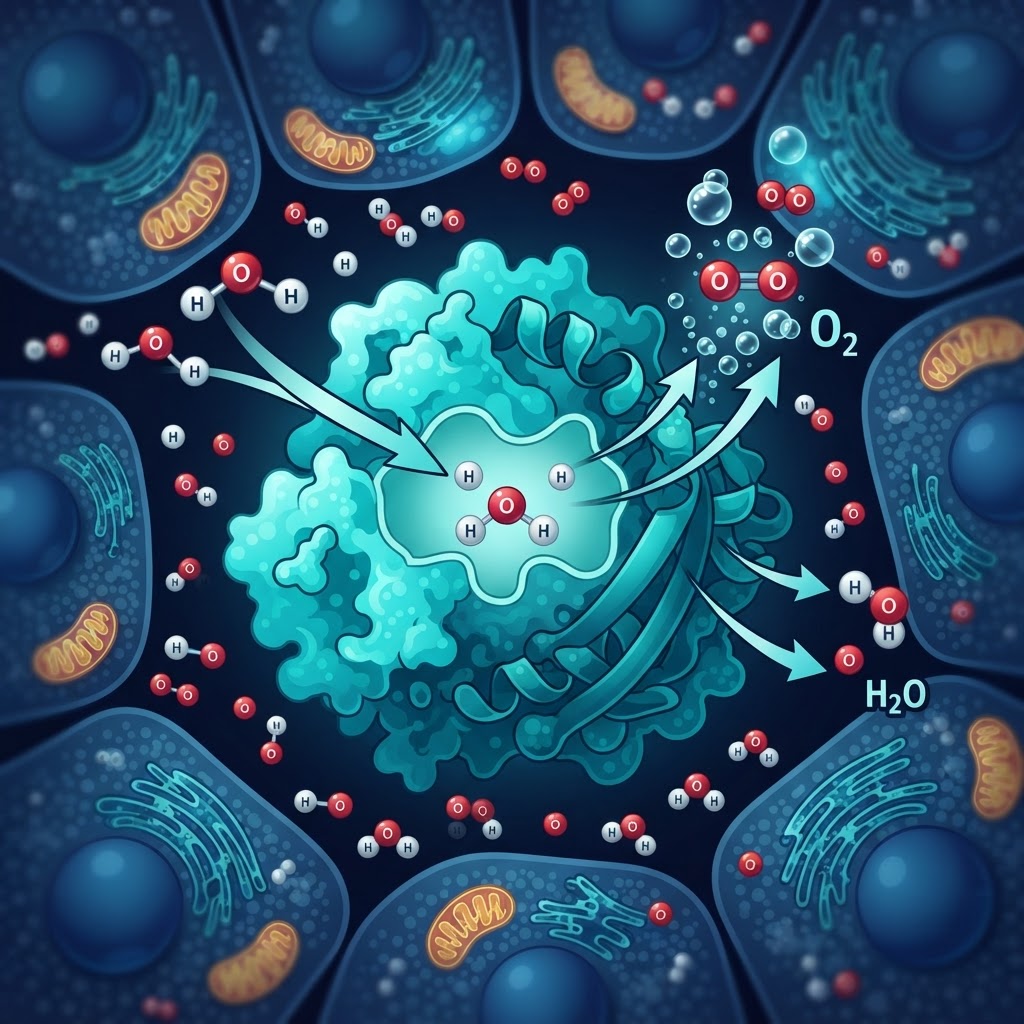
The Enzyme Activity Lab fixes that. It runs a live simulation of catalase at work: substrate molecules drift, collide with enzymes, bind in the active site, and release oxygen bubbles that rise and pop. Students pick a variable, set a range, and click "Run trials." The lab records the rate at each value and plots the curve. By the end of a ten-minute investigation, students have designed an experiment, collected data, and read a rate curve they built themselves.
Open the Enzyme Activity Lab
The interactive runs in any browser, no login required. Open it now with your students, or sign up free to copy it to your dashboard and share it via QR code.
No credit card required · Free to start · Works on Chromebooks and tablets
What Students Can Do
Design the experiment
Students pick one factor to investigate — temperature, pH, substrate, enzyme, or inhibitor — write a hypothesis, and set the range of values to test. The lab runs the trials and plots the results.
Find the optimum and the cliff
A temperature sweep shows the rate climb to a peak and then crash. Students see that cold slows the enzyme reversibly, but heat denatures it permanently as the active site loses its shape.
Map pH to shape
A pH sweep reveals the bell curve. Students learn that extreme pH changes the charge on amino acid R groups, disrupting the bonds that hold the active site.
Read saturation and inhibition
A substrate sweep produces the classic plateau. Switching between competitive and non-competitive inhibition shows how extra substrate restores Vmax in one case and not the other.
A Ready-to-Use Investigation Sequence
The lab ships with a guided "Investigate" panel for each factor. Hand students these prompts and let them discover the science before you explain it.
Pick Temperature. Run trials from 0 °C to 80 °C. Where is the optimum, and why does the rate fall so sharply above it?
Check the science: Warming increases collisions and kinetic energy, so the rate climbs until the optimum. Beyond it, hydrogen and ionic bonds holding the tertiary structure break, the active site loses its shape, and the enzyme denatures irreversibly.
Pick pH. Sweep from 1 to 13. Where does catalase peak, and what happens to the active site at the extremes?
Check the science: pH changes the charge on amino acid R groups. Extreme values disrupt ionic and hydrogen bonds, altering the active site so the substrate no longer fits. This catalase model peaks near neutral.
Pick Substrate. Describe the curve. Why does it level off, and what single change would raise the plateau?
Check the science: At low substrate the rate rises almost linearly. At high substrate every active site is occupied (saturation), so extra substrate adds nothing. Raising enzyme concentration raises Vmax.
Pick Enzyme. What is the relationship between enzyme amount and rate? What would limit it if substrate were scarce?
Check the science: With excess substrate, rate is directly proportional to enzyme concentration. Once substrate runs short, extra enzyme has nothing to bind and the curve flattens.
Pick Inhibitor. Compare competitive and non-competitive at 10 mM and 90 mM substrate. What changes and what stays the same?
Check the science: A competitive inhibitor blocks the active site, so extra substrate outcompetes it and Vmax is still reached. A non-competitive inhibitor binds an allosteric site, changes the active site shape, and Vmax falls.
Why an Interactive Beats a Diagram
A rate curve is the answer to an experiment. Handing students a finished curve skips the most important part: deciding what to vary, predicting what will happen, and watching the data come in. The Enzyme Activity Lab makes students run the experiment before they read the curve, so the shape means something.
The lab also makes the link between structure and function visible. When a student heats the enzyme past its optimum, the enzymes on screen visibly distort — the smooth circles become jagged, misshapen blobs, and the rate collapses. Denaturation stops being a vocabulary word and becomes something they have caused and seen.
Best of all, the inhibition comparison is inquiry-first. A student who adds a competitive inhibitor and watches extra substrate restore the rate has to reconcile that with the non-competitive case where it does not. That contrast is the exact cognitive conflict that makes allosteric regulation memorable instead of memorized.
Learning Outcomes
Design a controlled investigation: pick one factor (temperature, pH, substrate, enzyme, or inhibitor), write a hypothesis, and run trials to test it.
Explain the shape of a rate curve, including the optimum, the denaturation cliff, and the saturation plateau (Vmax and Km).
Distinguish competitive from non-competitive inhibition using the effect of extra substrate on Vmax, and describe where each inhibitor binds.
Relate enzyme structure to function: how hydrogen and ionic bonds hold the active site, and how heat and extreme pH break them.
Ontario Curriculum Alignment
The activity directly supports the Metabolic Processes strand in SBI4U (Grade 12 University Biology) and the Biochemistry strand in SBI4C (Grade 12 College Biology).
| Course | Strand | Expectation |
|---|---|---|
| SBI4U | Metabolic Processes · B2 | investigate the chemical transformations of matter and energy in living cells, including enzyme activity and the factors that affect the rate of enzyme-catalysed reactions. |
| SBI4U | Metabolic Processes · B3 | demonstrate an understanding of metabolic processes, including the role of enzymes as biological catalysts and the effect of temperature, pH, and substrate concentration on reaction rate. |
| SBI4C | Biochemistry · C2 | investigate the chemical structures and properties of key biological molecules, including enzyme function and the effect of pH and temperature on catalysis. |
Bring the Enzyme Activity Lab to Your Students
Open the interactive free in any browser, or sign up to copy it to your dashboard, share it with a QR code, and pair it with your own AI chatbot for a full lesson bundle.